Projects
- IMPECAF
- Description
- People
- Deliverable
- Databases
- IMDROFLOOD
- Description
- People
- Deliverable
- Databases
QSECA
1)
The SPI and SPEI were computed using the Climatic Research Unit (CRU) TS3.21 High Resolution Gridded Data of Month-by-month Variation in Climate dataset (available online at http://badc.nerc.ac.uk/data/cru/), with a spatial resolution of 0.5 degrees and for the period 1901-2012.
The study region of IP corresponds to a square of 30×30 grid boxes (Figure 1).
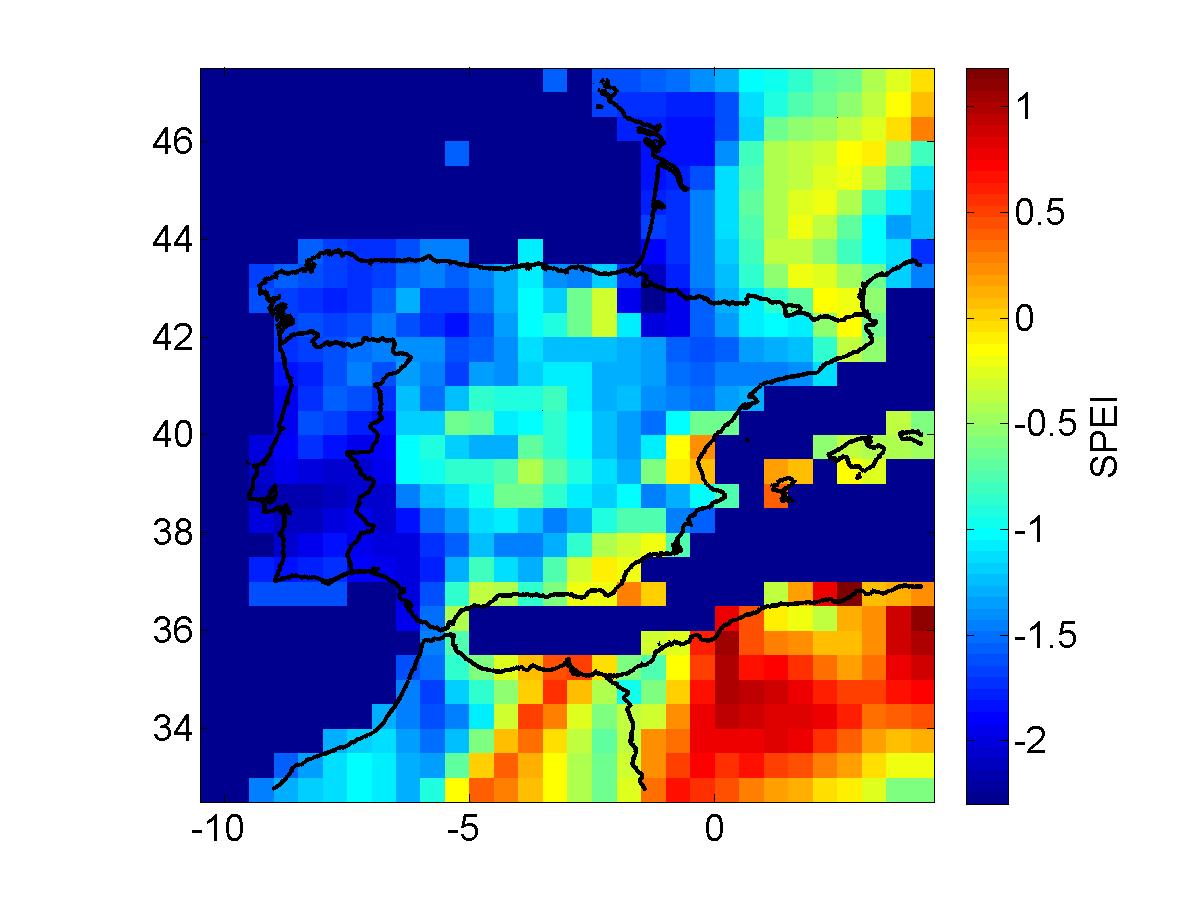
Fig 1 Example of gridded SPEI.
The reference Evapotranspiration (ET0) obtained was using the Hargreaves approach.
The SPEI fitting was made by the log-logistic probability distribution through a L-moment approach.
The SPI was made by the gamma distribution.
For access to these databases, please contact: e-mail
2)
The SPI and SPEI were also computed using the high resolution data at 10 km spatial resolution – from 1959 to 2007 (Jerez et al., 2011) for the period between 1959 and 2007.
We computed the reference Evapotranspiration (ET0) using the Thornthwaite approach.
The SPEI fitting was made by the log-logistic probability distribution through a L-moment approach.
The SPI fitting was made by the gamma probability distribution.
In order to have access to this data contact e-mail.
3)
The SPI and SPEI were also computed using the high resolution data, at 9 km spatial, obtained through regional modeling of EC-Earth simulations – from 2071 to 2100 (Soares et al., 2012).
We computed the reference Evapotranspiration (ET0) using the Hargreaves approach.
The SPEI fitting was made by the log-logistic probability distribution through a L-moment approach.
The SPI fitting was made by the gamma probability distribution.
In order to have access to this data contact e-mail.