Research
- Climate Variability
- Weather types
- North Atlantic Oscilation
- Blocking events
- Storm-tracks
- Cut-off low systems
- Climate extremes
- Vegetation dynamics
- Atmopsheric Rivers
- Nonlinear Analysis
- Natural Hazards
- Datasets
Heatwaves
The last decade has been characterized by frequent heatwaves within the Mediterranean-European region. Quite often these heatwaves have triggered a large number of wildfires, as it was the case of Portugal (2003), Spain (2006), Italy and Greece (2007) and, more recently, Ukraine and Russia (2010). The 2003 European heat wave was directly associated for approximately 50.000 extra deaths in Europe, particularly of elderly people, corresponding to 20 times the excess mortality recorded during the 1995 Chicago heat wave. France suffered the heaviest burden of excessive mortality mortality (Trigo et al., 2005). Heavy losses in crops, a loss of 10% of mass in Alpine glaciers, temperature records in lake waters, unprecedented shortage of the pollen season, jointly with threats to water and energy supply systems were also recorded (García-Herrera et al. 2010). Additionally this heat wave demonstrated the failure of social and health systems to react adequately to this type of extreme events, which will become more frequent in the future, according to climate change scenarios obtained with the state-of-the-art climate models (Trigo et al., 2009; García-Herrera et al. 2010).
An updated assessment of the Portuguese excessive mortality associated with this event shows a total of 2399 excessive deaths are estimated in continental Portugal, which implies an increase of 58% over the expected deaths (Trigo et al., 2009).
Additionally during the summer 2003, Portugal was hit by the most devastating sequence of large fires, responsible for a total burned area of 450 000 ha (including 280 000 ha of forest), representing about 5% of the Portuguese mainland (Trigo et al., 2006). Recently we have developed, based on data obtained from the VEGETATION-SPOT5 instrument, a methodology to identify large burnt scars and evaluate the recover process of these burnt areas for the 2003 fire (Gouveia et al., 2010).
Following the methodology developed in previous works we have characterized extensively the temporal evolution of the large-scale atmospheric circulation and fire activity associated with the two largest heatwaves observed over western Europe in 2003 (Trigo et al., 2005) and over Russia in 2010 (Barriopedro et al., 2011).
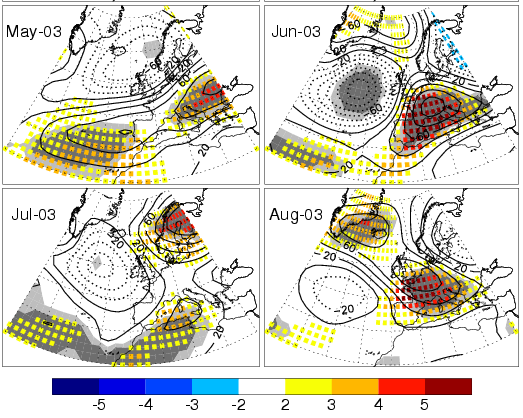
Figure 1. Monthly anomalies of 500 hPa geopotential height (gpm) between May and August 2003 with respect to the period 1961-1990. The shading highlights those regions where these anomalies are significantly different from the climatology at the 10% and 5% level. The coloured squares represent the corresponding 850 hPa temperature anomaly field (şC). All data from NCAR/NCEP reanalyses (from García-Herrera et al. 2010).
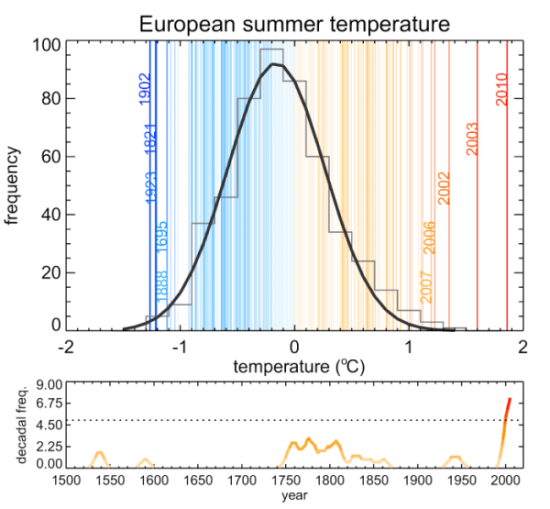
Figure 2. European summer temperatures for 1500-2010. Statistical frequency distribution of European ([35şN, 70şN], [25şW, 40şE]) summer land temperature anomalies (şC, relative to the 1970-1999 period) for the 1500-2010 period (vertical lines). The five warmest and coldest summers are highlighted. Grey bars represent the distribution for the 1500-2002 period with a Gaussian fit in black (from Barriopedro et al., 2011).
References:
- Barriopedro D., Fisher E., Luterbacher J., Trigo R.M., García-Herrera R., (2011) “The hot summer of 2010: redrawing the temperature record map of Europe”. Science, 322, 220.
- García-Herrera R., Díaz J., Trigo R.M., Luterbacher J., Ficher E. (2010) “A review of the European summer heat wave of 2003”. Critical Reviews in Environmental Science and Technology, 40, 267 - 306
- Gouveia C., DaCamara C.C, Trigo R.M., (2010) " Post fire vegetation recovery in Portugal based on SPOT-VEGETATION data ", Natural Hazards and Earth System Sciences, 10, 673-684.
- Trigo R.M., García-Herrera R., Díaz J., Trigo I.F., Valente A. (2005) “How exceptional was the early August 2003 heatwave in France?”. Geophysical Research Letters, 32, L10701, doi:10.1029/2005GL022410
- Trigo R.M., Pereira J.M.C., Pereira M.G., Mota B., Calado M.T., DaCamara C.C., Santo F.E. (2006) “The exceptional fire season of summer 2003 in Portugal”. International Journal of Climatology, 26, 1741-1757, 2006.
- Trigo, R.M., Ramos A., Nogueira P., Santos F.D., Garcia-Herrera R., Gouveia C. and Santo F.E. (2009) "Evaluating the impact of extreme temperature based indices in the 2003 heatwave excessive mortality in Portugal", Environmental Science & Policy, 12, 844 - 854.