Research
- Climate Variability
- Weather types
- North Atlantic Oscilation
- Blocking events
- Storm-tracks
- Cut-off low systems
- Climate extremes
- Vegetation dynamics
- Atmopsheric Rivers
- Nonlinear Analysis
- Natural Hazards
- Datasets
Vegetation dynamics
Recent global changes in vegetation dynamics have been continuously monitored from space and, additionally, significant connections with changes of surface climatic variables, such as temperature and precipitation, have been established (Buermann et al., 2004; Nemani et al., 2003). In particular, the observed increment in temperature during spring and autumn over high-latitude regions of the Northern Hemisphere leads to higher photosynthetic activity and larger growing seasons. However, whereas in spring photosynthesis dominates respiration, the opposite takes place in autumn. Consequently, in a future warmer world, carbon sequestration capacity by northern hemisphere ecosystems may decrease faster due to a faster warming in autumn than in spring (Sitch et al., 2008). Nevertheless, changes in the seasonality of temperature and precipitation may have distinct impacts, depending on local characteristics.
Vegetation Indices, as obtained from remote sensing information, has been used widely in the Climatology and Climate Change group of Instituto Dom LuĒz (IDL), in order to assess the impact of climate variability on vegetation greenness over Europe and Iberian Peninsula (Gouveia et al., 2008). In particular the impact of North Atlantic Oscillation (NAO) in vegetation activity (Figure 1) and in Net Primary Production (NPP) over Iberian Peninsula has been evaluated (Gouveia et al., 2008, Gouveia and Trigo, 2011), as well as the impact on Portuguese wheat productivity (Gouveia and Trigo, 2011).
Remote sensing information has also been used to monitor drought events and to assess the vegetation response during and after extreme drought events. In particular the case 2004/2005 drought event (Figure 2) in Portugal was analyzed (Gouveia et al., 2009), as well as the years of 1998/99 and 2001/2002. Other drought events in different regions of the globe were also studied and the role of vegetation evaluated, such as the intense 2007/2009 drought in the Fertile Crescent (Trigo et al, 2010) and the 2009/10 drought in China (Barriopedro et al., 2012).
Vegetation indices, namely the Normalized Difference Vegetation Index (NDVI), has been used in order to modeling crops production/productivities, namely in the case of chestnut productivity in the Northeastern Portugal (Pereira et al., 2011) and in the case of Douro wine production (Gouveia et al., 2011).
The Climatology and Climate Change group within collaboration with Land Climate Interaction group has developed a model based on NDVI to monitor the vegetation recovery after large fires in Portugal (Gouveia et al., 2010). The quality of the model has been evaluated and the model applied to other years and areas within Iberian Peninsula and Mediterranean countries (Bastos et al. 2011). The model has also been used to assess the impact of drought periods after large fire events (Gouveia et al, 2012).
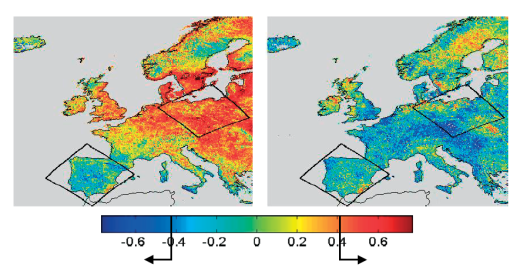
Figure 1. Correlation fields of NAOJFM versus NDVIMAM (left panel) and NAOJFM versus NDVIJJA (right panel) over the period from 1982 to 2002. (From Gouveia et al., 2008)
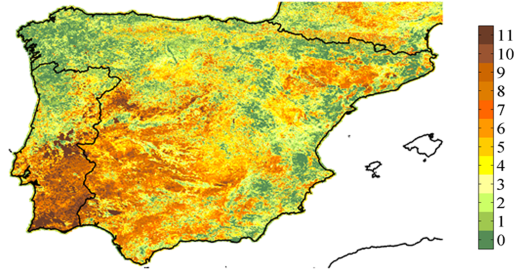
Figure 2. Number of months between September 2004 and July 2005 characterized by lower than usual vegetation activity, as obtained by negative NDVI anomaly values (From Gouveia et al., 2012)
References:
- Buermann W, Anderson B, Tucker CJ, Dickinson RE, Lucht W, Potter CS, Myneni RB. 2003. Interannual covariability in Northern Hemisphere air temperatures and greenness associated with El Ni±o-southern oscillation and the Arctic Oscillation. Journal of Geophysical Research, 108: 4396, DOI:10.1029/2002JD002.
- Barriopedro D., Gouveia C, Trigo R.M, Wang L., (2012) ōThe 2009-2010 drought in China: possible causes and impacts on vegetationö. Journal of Hydrometeorology, doi: 10.1175/JHM-D-11-074.1
- Bastos A., Gouveia C., DaCamara C.C., Trigo R.M., (2011) ōModelling post-fire vegetation recovery in Portugalö. Biogeosciences, 8, 4559-4601, Copernicus Publications on behalf of the European Geosciences. Union, doi: 10.5194/bgd-8-4559-2011.
- Gouveia C., Trigo R.M., DaCamara C.C., Libonati R., Pereira J.M.C. (2008) "The North Atlantic Oscillation and European vegetation dynamics" International Journal of Climatology, DOI: 10.1002/joc.1682
- Gouveia, C., Trigo, R. M., and DaCamara, C. C. (2009) ōDrought and vegetation stress monitoring in Portugal using satellite dataö, Nat. Hazards Earth Syst. Sci., 9, 185¢195, doi:10.5194/nhess-9-185- 2009.
- Gouveia, C., DaCamara, C. C., and Trigo, R. M. (2010) ōPost-fire vegetation recovery in Portugal based on spot/vegetation dataö, Nat. Hazards Earth Syst. Sci., 10, 673¢684, doi:10.5194/nhess-10- 673-2010.
- Gouveia C.; Liberato M. L. R.; DaCamara C. C.; et al. (2011) Modelling past and future wine production in the Portuguese Douro Valley. Climate Research, 48, 2-3, 349-362, DOI: 10.3354/cr01006
- C. Gouveia, R.M. Trigo (2011) "The impacts of the NAO on the Vegetation Activity in Iberia", in Hydrological, Socioeconomic and Ecological impacts of the North Atlantic Oscillation in the Mediterranean region, Ed. Vicente-Serrano S., Trigo R. M and GarcĒa-Herrera R., Advances in Global Change Research 46, Springer, 113-128.
- Gouveia C.M., Bastos A., Trigo R.M., DaCamara C.C. (2012) "Drought impacts on vegetation in the pre and post-fire events over Iberian Peninsula". Natural Hazards and Earth System Sciences, 12, 3123-3137.
- Nemani, R.R., Keeling, C.D., Hashimoto, H., Jolly, W.M., Piper, S.C., Tucker, C.J., Myneni, R.B. and Running, S.W., (2003): Climate-driven increases in global terrestrial net primary production from 1982 to 1999. Science, 300: 1560-1563.
- Pereira M.G., Caramelo L., Gouveia C., Gomes-Laranjo J., MagalhŃes M. (2011) "Assessment of Weather-related Risk on Chestnut Productivity". Natural Hazards and Earth System Sciences, 11, 2729¢2739.
- Sitch, S., Huntingford, C., Gedney, N., Levy, P.E., Lomas, M., Piao, S.L., Betts, R., Ciais, P., Cox, P., Friedlingstein, P., Jones, C.D., Prentice, I.C. and Woodward, F.I., (2008): Evaluation of the terrestrial carbon cycle, future plant geography and climate¢carbon cycle feedbacks using 5 Dynamic Global Vegetation Models (DGVMs). Global Change Biology, 14: 2015-2039.
- Trigo R.M., Gouveia C., Barriopedro D. (2010): The intense 2007-2009 drought in the Fertile Crescent: Impacts and associated atmospheric circulation. Agricultural and Forest Meteorology, 150, 1245-1257.